Trends view
Table of contents:
👱🏾 User experience
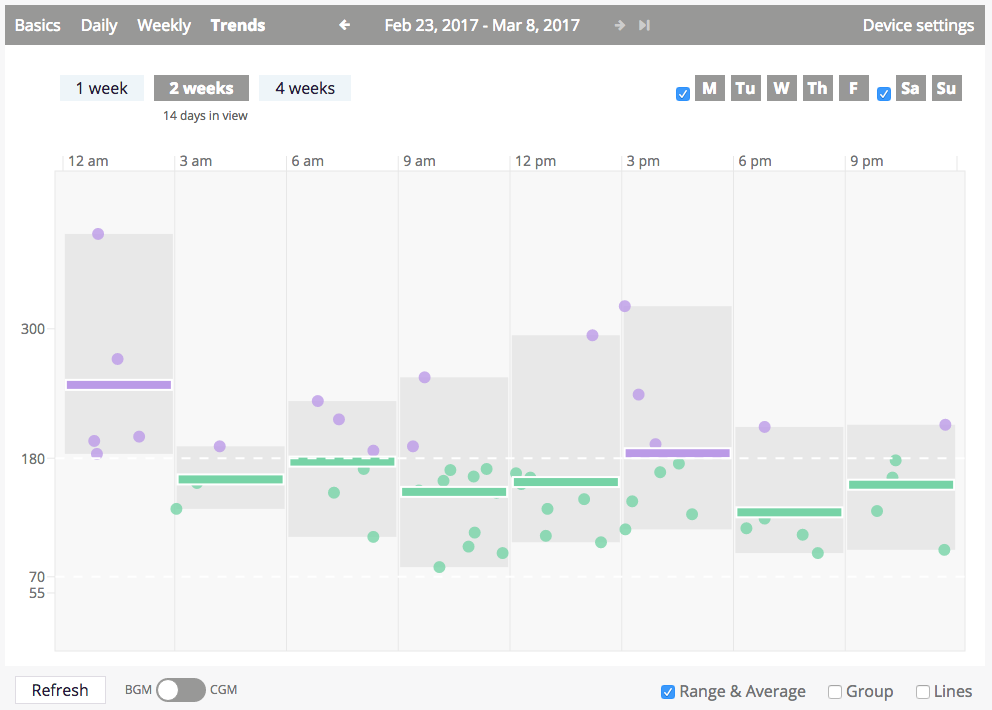
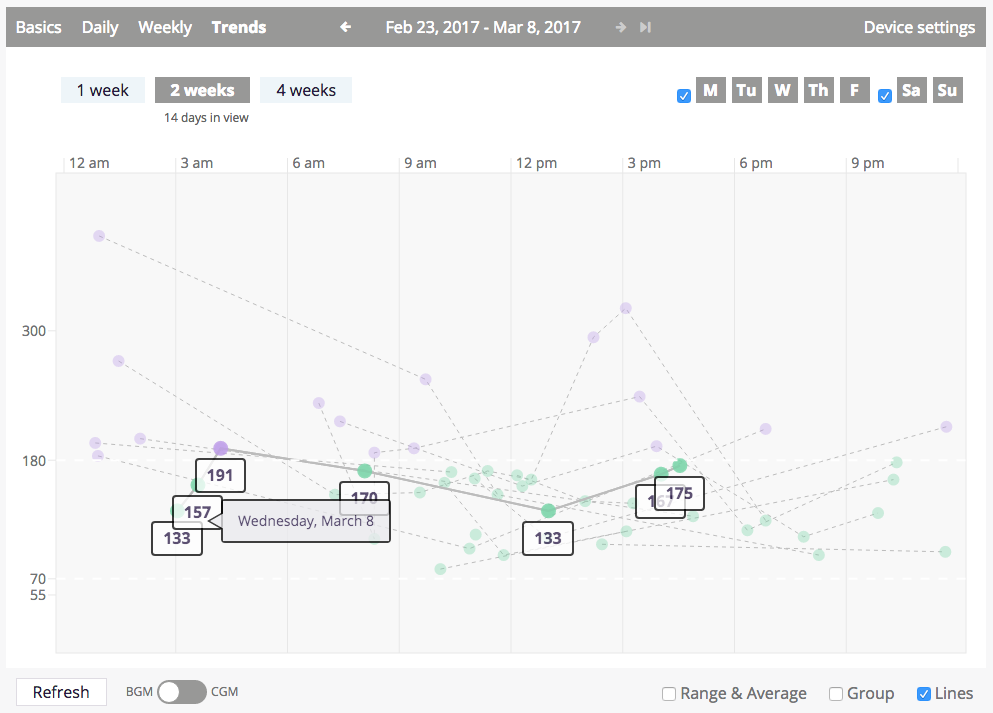
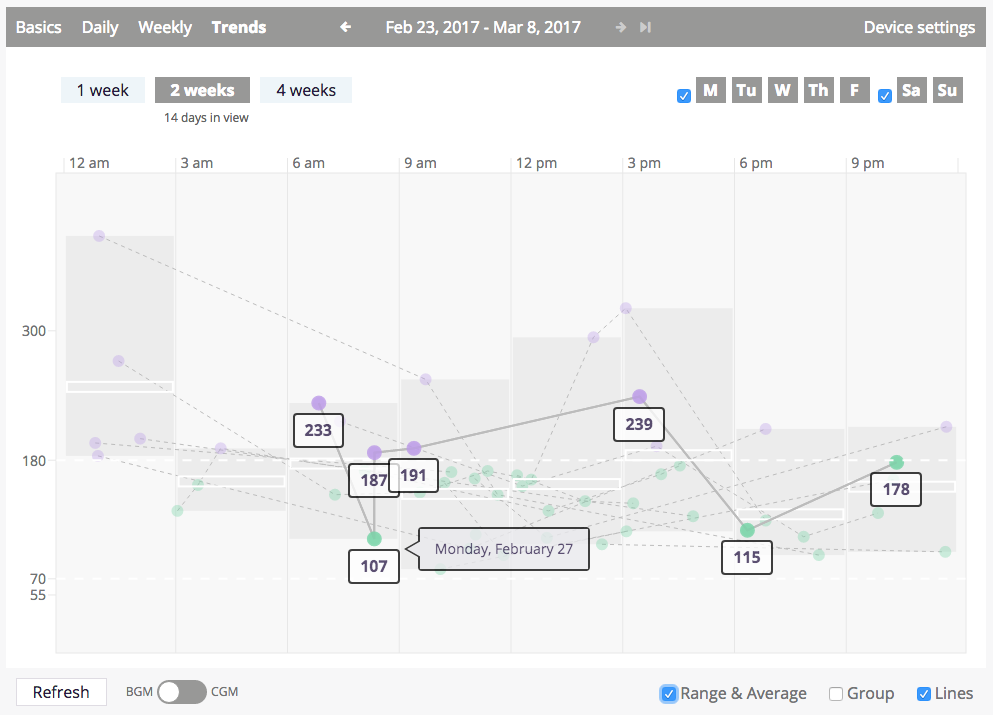
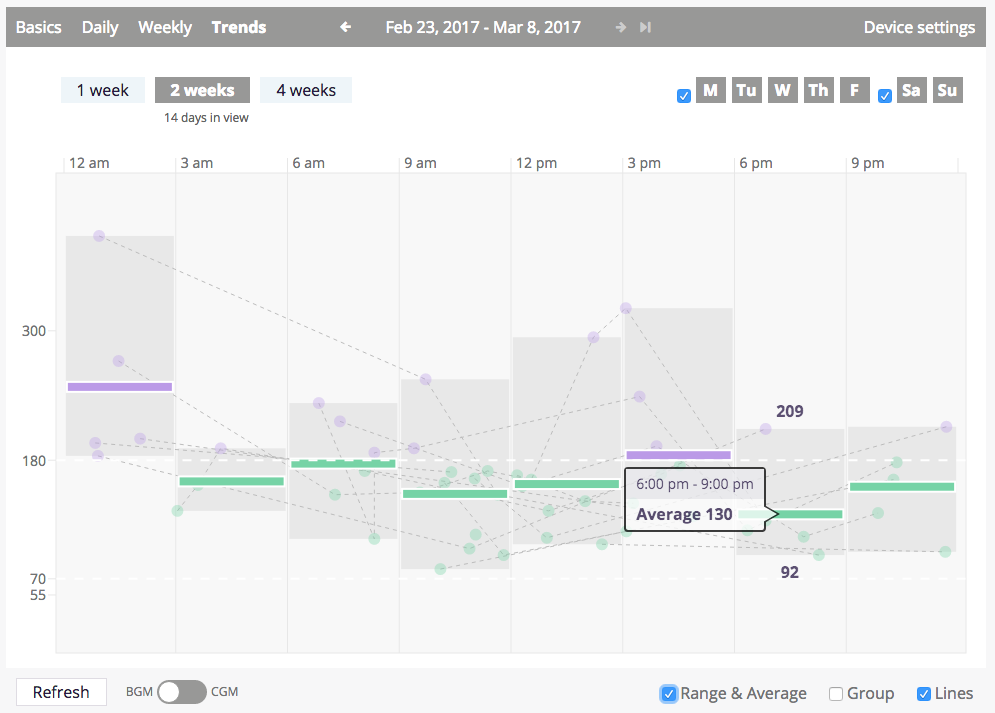
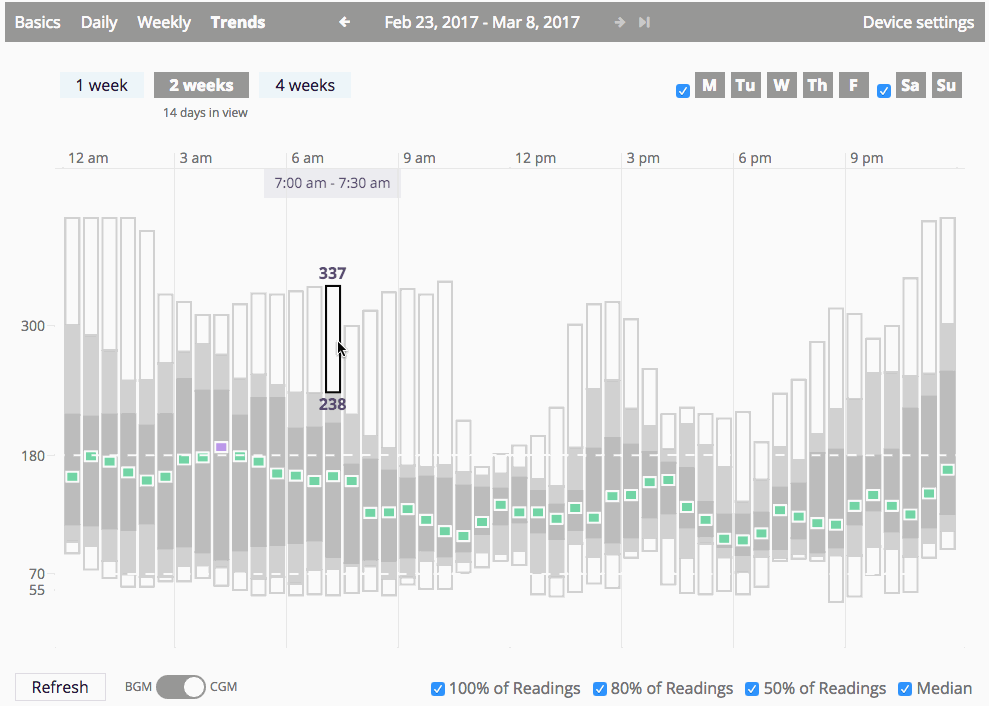
There are two versions of the Trends view, one for displaying trend information based on fingerstick blood glucose data and the other for displaying trend information based on CGM data. The BGM version was developed first, and the CGM version is a more recent addition. A 14-day span of data is the default for this view, although the user can toggle to 7 days or 28 days using selectors displayed in the upper left corner of the display. (In the upper right of the display, the user can toggle days of the week such as Monday, Tuesday, etc. or weekdays vs. weekends off and on.) Both the CGM and CGM versions group all data in the selected span of time by time of day in an effort to show how blood glucose varies for the PwD by time of day. On the BGM version where the data is quite sparse, the data is grouped into three-hour "bins," and on the CGM version thirty-minute bins are used.
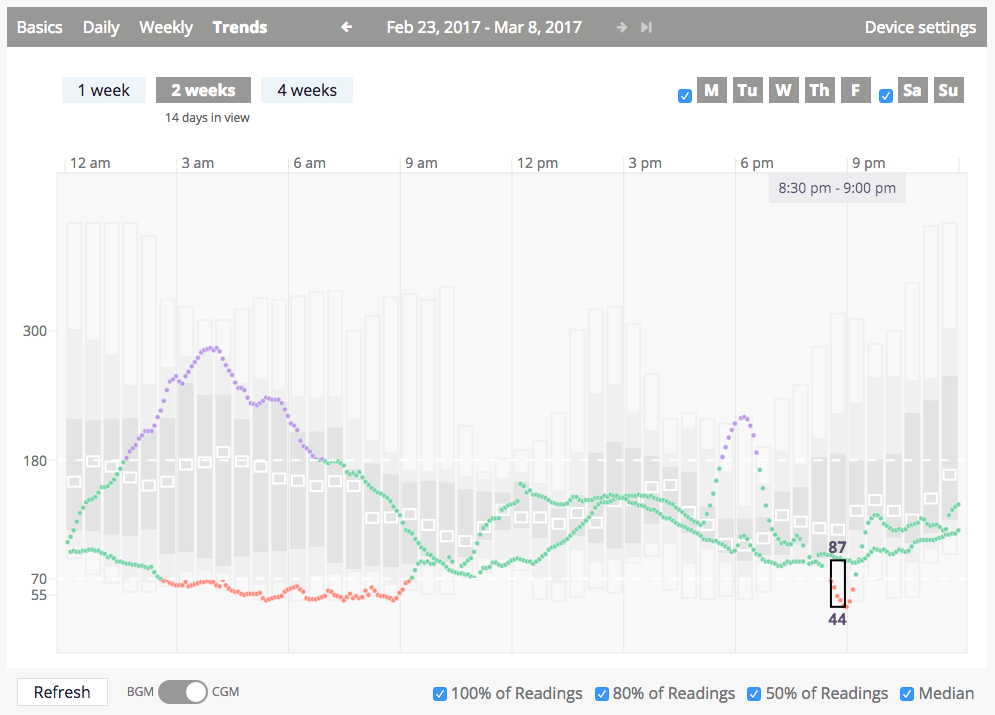
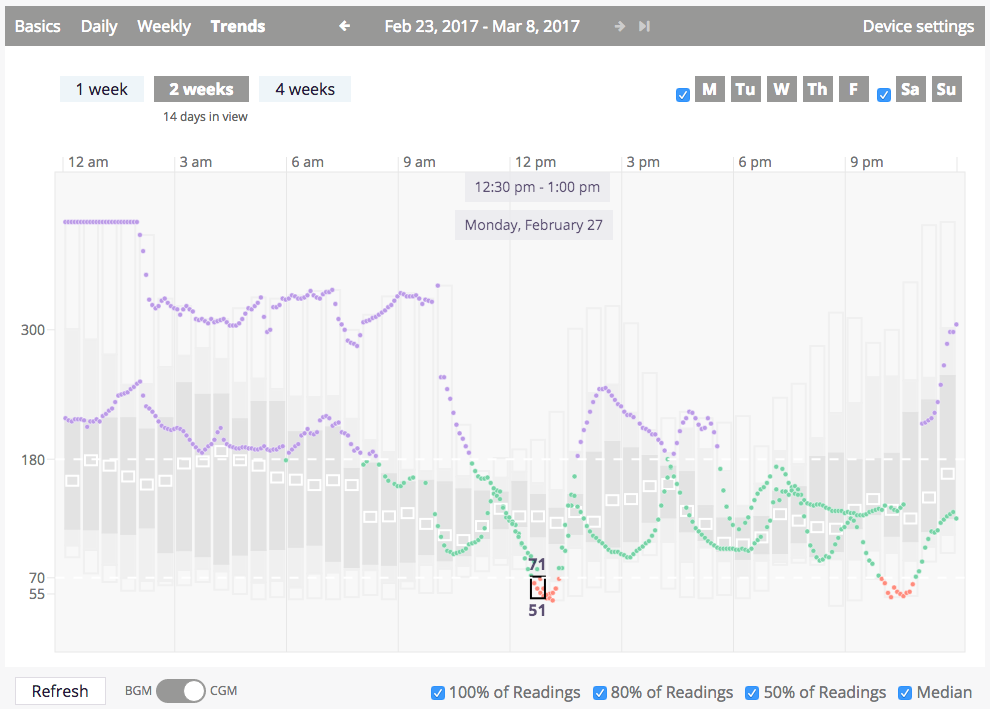
CGM Trends as of March, 2017
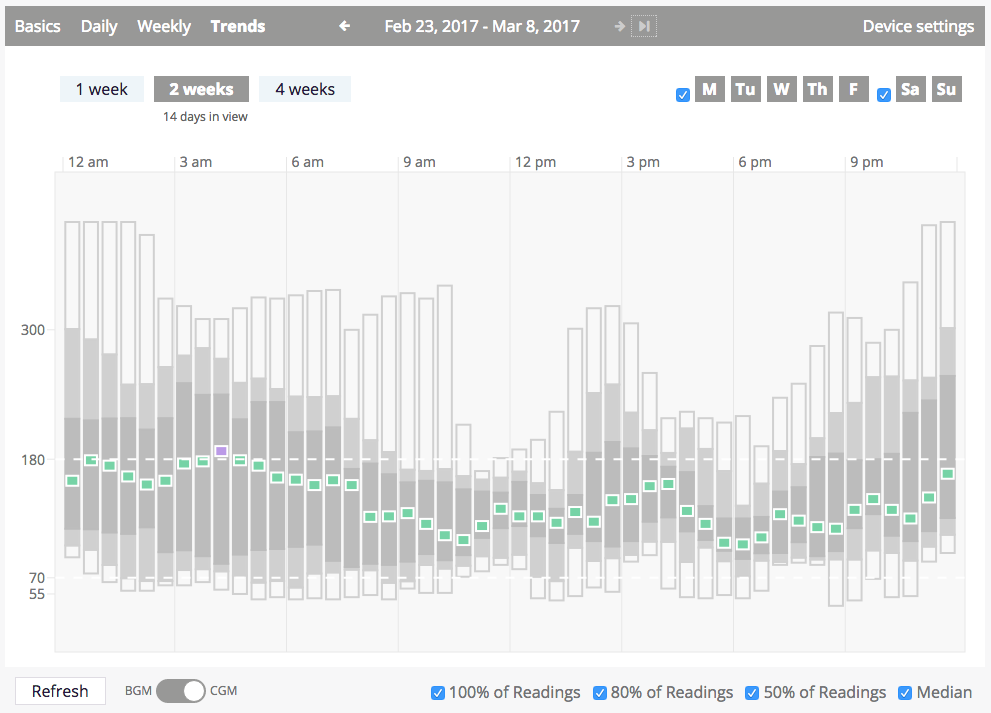
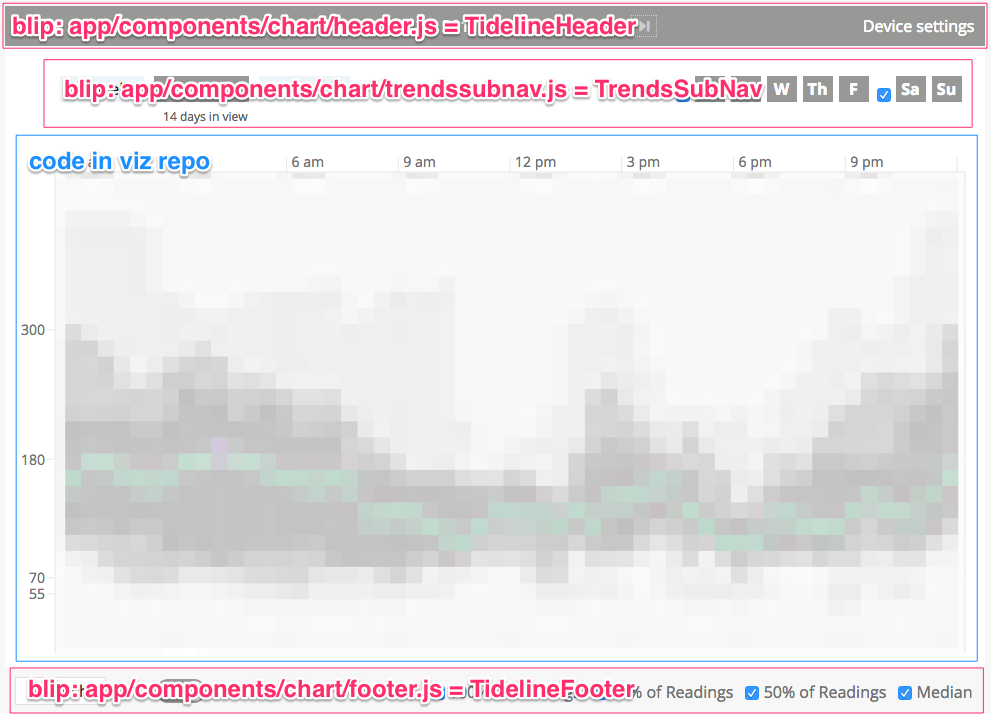
BGM Trends as of March, 2017
Like on the Daily view, hovering over various items in the display will produce a tooltip with more information. In addition, hovering on a segment of a time slice on the CGM version will expose all of the CGM daily sensor traces that intersect with that segment after a short delay (i.e., the pointer must remain on the same segment for a threshold of milliseconds before the exposure of traces is triggered).
BGM Date Line Hover
BGM Individual smbg Hover
BGM Range Box Hover
CGM Segment Hover
CGM Segment Hover + Hold
CGM Segment Hover + Hold on cbg
🏛️ Architecture
Currently only the data visualization itself for the BGM and CGM versions of the Trends view are implemented in this repository: code in blip is still being used for the 7, 14, and 28 days domain size selectors, the day of the week selectors, and of course the visualization sub-header that provides navigation between the views and along the datetime dimension. This makes the interface(s) between the blip and viz code a bit messier than they should be.
Component hierarchy
CGM Trends
└── PatientData (Redux-connected)
    └── Trends
        ├── TidelineHeader
        ├── TrendsSubNav
        ├── <div className="patient-data-content">
        │   ├── <div id="tidelineContainer">
        │   │   └── TrendsContainer
        │   │       └── TrendsSVGContainer (wrapped in DimensionsHOC)
        │   │           ├── Background
        │   │           ├── XAxisLabels
        │   │           ├── XAxisTicks
        │   │           ├── YAxisLabels
        │   │           ├── <g id="cbgTrends">
        │   │           │   ├── CBGSlicesContainer
        │   │           │   │   └── <g id="cbgSlices">{48 CBGSliceAnimated, each wrapped in WithDefault HOC}</g>
        │   │           │   └── CBGDateTracesAnimationContainer
        │   │           │       └── ReactTransitionGroupPlus
        │   │           │           └── <g id="cbgDateTraces">{n CBGDateTraceAnimated where n is number of exposed CGM sensor traces}</g>
        │   │           └── TargetRangeLines
        │   ├── CBGDateTraceLabel
        │   └── FocusedRangeLabels
        └── TidelineFooter
BGM Trends
└── PatientData (Redux-connected)
    └── Trends
        ├── TidelineHeader
        ├── TrendsSubNav
        ├── <div className="patient-data-content">
        │   ├── <div id="tidelineContainer">
        │   │   └── TrendsContainer
        │   │       └── TrendsSVGContainer (wrapped in DimensionsHOC)
        │   │           ├── Background
        │   │           ├── XAxisLabels
        │   │           ├── XAxisTicks
        │   │           ├── YAxisLabels
        │   │           ├── <g id="smbgTrends">
        │   │           │   ├── SMBGRangeAvgContainer (for range behind smbgs)
        │   │           │   │   └── <g className="smbgAggContainer">{up to 8 SMBGRangeAnimated (per default 3-hr binning), each wrapped in WithDefault}</g>
        │   │           │   ├── SMBGsByDateContainer
        │   │           │   │   └── <g id="smbgsByDateContainer">{up to n each of SMBGDateLineAnimated and SMBGDatePointsAnimated where n is # of days in view; all of these components are Redux-connected}</g>
        │   │           │   │       └── <g id="">
        │   │           │   └── SMBGRangeAvgContainer (for avg in front of smbgs)
        │   │           │   │   └── <g className="smbgAggContainer">{up to 8 SMBGMeanAnimated (per default 3-hr binning), each wrapped in WithDefault}</g>
        │   │           └── TargetRangeLines
        │   └── FocusedRangeLabels
        └── TidelineFooter
📐 Layout
The variables involved in the layout of the data display inside the Trends view—that is, the code for Trends view contained in this repository—are as follows, all originating in the TrendsSVGContainer:
containerHeightandcontainerWidthare the dimensions of the<div id="tidelineContainer">that the data portion of every view is rendered within. These are provided onTrendsSVGContaineras props via theDimensionshigher-order component (HOC) that wraps the SVG container. ThisDimensionsHOC is an external dependency from thereact-dimensions.- The
MARGINS(a constant oftop,bottom,left, andrightproperties) are the space outside the data display area (gray box) that provide padding around the data display area and space for the x- and y-axis ticks and labels. - The
BUMPERS(a constant oftopandbottomproperties) are the internal padding in the data display area.
Altogether, in diagram form (though not to scale):

💣 Tech Debt
- Because of where they need to be rendered in the component hierarchy, the hover tooltip component(s) are currently being rendered in blip, and so as an expedient way to share the hover state between the viz code and the blip code, we are using Redux actions to represent the hover focus on element(s). Since hover state is not the kind of state that it makes sense to persist when a user navigates away from the visualization part of the app before coming back, the Redux store is not the appropriate place to store this state. Rather, this state should probably be contained in the React component state of a high-level container component in Trends.
- When you hover a date line on the smbg side of Trends, instead of properly pulling the line to the top we just render a second version of the line on top.
🚀 The Future
At present the <div id="tidelineContainer"> is given a fixed size via blip's styling, but as we introduce responsiveness in blip, we will be able to leverage the behavior of the Dimensions HOC to make the dataviz responsive. Dimensions will update the containerHeight and containerWidth props on TrendsSVGContainer on window resize, and then by implementing a componentWillReceiveProps on TrendsSVGContainer we will be able to adjust the dimensions of the rendered SVG and the ranges of the x and y scales created with D3 to respond to the new viewport size.